Core Web Vitals Explained: How Page Speed Impacts Your Rankings
Understand Core Web Vitals (LCP, INP, CLS) and how they affect your search rankings. Practical optimization tips for better performance.
Rodrigo Diniz
AEO Strategy Lead & GEO Specialist

To give your business the best chance of ranking locally, we need to talk about speed—specifically, how Google measures it.
You know how frustrating it is when a website takes forever to load on your phone while you’re trying to check a menu or book a tour.
Google knows this too, which is why they introduced Core Web Vitals as a major part of their ranking algorithm.
For businesses investing in organic SEO and technical SEO services, understanding and optimizing these metrics is fundamental.
We see this often with our Honolulu clients: a beautiful site that underperforms simply because it fails these specific technical checks.
In this guide, we will break down exactly what these metrics are, why they matter for your local rankings, and how to fix them.
What Are Core Web Vitals?
Core Web Vitals are a set of specific metrics that Google uses to measure real-world user experience on web pages.
We have seen them evolve significantly since their introduction, especially with the major update in March 2024 that replaced First Input Delay (FID) with Interaction to Next Paint (INP).
These metrics evaluate how quickly your page loads, how quickly it responds to user interaction, and how visually stable it remains during loading.
Google’s page experience signals consider Core Web Vitals alongside mobile-friendliness, HTTPS security, and the absence of intrusive interstitials.
While content relevance remains the primary ranking factor, Core Web Vitals serve as a tiebreaker when multiple pages compete for the same position.
A fast, responsive website not only ranks better but converts more visitors into customers.
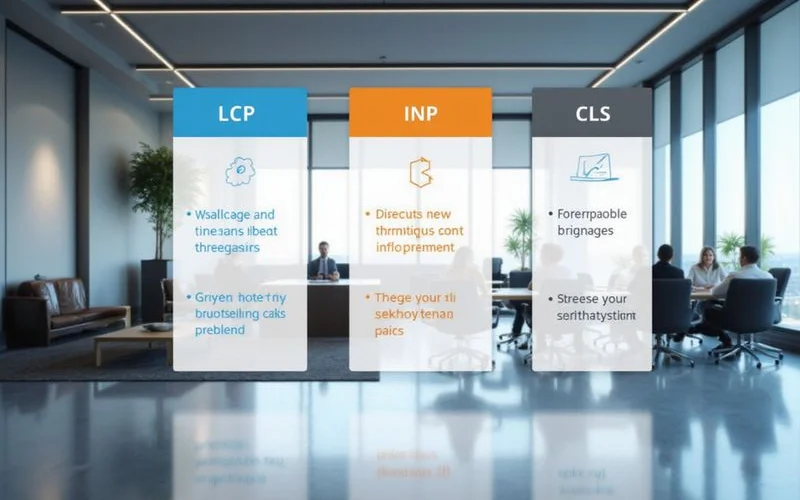
The three Core Web Vitals metrics are:
- LCP (Largest Contentful Paint) — Loading performance
- INP (Interaction to Next Paint) — Interactivity responsiveness
- CLS (Cumulative Layout Shift) — Visual stability

LCP: Largest Contentful Paint
LCP measures how long it takes for the largest visible content element to render on screen.
We typically see this element as a hero image, a video thumbnail, or a large text block at the top of the page.
It reflects the moment a user perceives the page as “loaded.”
LCP Thresholds
| Rating | Time |
|---|---|
| Good | Under 2.5 seconds |
| Needs Improvement | 2.5 - 4.0 seconds |
| Poor | Over 4.0 seconds |
What Causes Poor LCP
Geographic Latency (The “Ocean Tax”): For Hawaii businesses, server location is a critical, often overlooked factor. If your website is hosted on a server in New York or London, data has to travel thousands of miles to reach a user in Honolulu, adding 100-150ms of unavoidable latency to every request.
Slow server response times: If your server takes too long to respond to requests, everything downstream is delayed. Server response time (TTFB) above 800ms typically leads to poor LCP.
Render-blocking resources: CSS and JavaScript files that must load before the browser can render content will delay LCP. Large, unoptimized stylesheets are a common culprit.
Large, unoptimized images: The LCP element is frequently a hero image. If that image is a 3MB JPEG served without compression or modern formats, LCP suffers significantly.
How to Improve LCP
- Host Closer to Home: Move your hosting to a US West Coast data center (like AWS us-west-1 in California) to cut latency for local users by nearly 50%.
- Use a Content Delivery Network (CDN): Services like Cloudflare have edge servers in Honolulu, allowing them to serve your content from right here on the island.
- Preload your LCP image: Use
<link rel="preload">to tell the browser to prioritize that hero image above everything else. - Serve images in modern formats: Use WebP or AVIF formats, which are often 30% smaller than JPEGs.
- Minimize render-blocking CSS: Inline critical styles so the browser can paint the page immediately.
INP: Interaction to Next Paint
INP replaced First Input Delay (FID) in March 2024 as the official responsiveness metric.
We focus heavily on this metric because it measures the responsiveness of all interactions throughout the page lifecycle, not just the first one.
INP tracks the time from when a user clicks, taps, or presses a key to when the browser presents the next visual update.
It captures the worst-case interaction latency, giving a more accurate picture of how responsive your page feels.
INP Thresholds
| Rating | Time |
|---|---|
| Good | Under 200 milliseconds |
| Needs Improvement | 200 - 500 milliseconds |
| Poor | Over 500 milliseconds |
What Causes Poor INP
Heavy JavaScript Execution: Any JavaScript task that blocks the main thread for more than 50ms prevents the browser from responding to user interactions.
We often find that third-party chat widgets, heavy tracking codes like the Meta Pixel, and unoptimized booking calendars are the main offenders here.
Complex Animations: Visual effects that rely on the main thread rather than the GPU can cause the browser to “freeze” while it calculates the new layout.
Excessive DOM size: Pages with thousands of DOM elements require more processing time for any interaction that triggers layout recalculations.
How to Improve INP
- Yield to the Main Thread: Use the modern
scheduler.yield()command orsetTimeoutto break up long tasks, giving the browser breathing room to respond to clicks. - Debounce Input Handlers: Ensure that search bars and forms don’t try to process every single keystroke instantly.
- Remove or defer non-essential scripts: If a chat widget is slowing down your mobile menu, set it to load only after the user interacts with the page.
- Use CSS transitions: Rely on CSS for animations instead of JavaScript, as CSS runs on a separate compositor thread.
CLS: Cumulative Layout Shift
CLS measures how much the visible content shifts unexpectedly during the page lifecycle.
We know nothing damages trust faster than a user clicking a “Book Now” button only to have an ad load and push the button down, causing them to click “Cancel” instead.
Layout shifts occur when visible elements change position without user interaction.
CLS Thresholds
| Rating | Score |
|---|---|
| Good | Under 0.1 |
| Needs Improvement | 0.1 - 0.25 |
| Poor | Over 0.25 |
What Causes Poor CLS
Dynamic Content Injection: Booking widgets for tours (like FareHarbor or Peek) or restaurant reservation tools (like OpenTable) often inject code that expands after the rest of the page has loaded.
Images without dimensions: When images lack explicit width and height attributes, the browser does not know how much space to reserve. Once the image loads, surrounding content shifts to accommodate it.
Web fonts causing FOIT/FOUT: When custom fonts load after the initial render, text can reflow and shift surrounding elements.
How to Improve CLS
- Reserve Space for Embeds: Wrap your booking widgets or ads in a
<div>container with a fixedmin-heightso the space is reserved before the content loads. - Set Explicit Dimensions: Always set
widthandheightattributes on images and video elements. - Use the Aspect-Ratio Property: This CSS property allows you to reserve the correct amount of space for responsive images based on their width.
- Preload Custom Fonts: Use
font-display: swapto ensure text remains visible and stable while your branded font loads.
How Core Web Vitals Affect Rankings
Google has been transparent that Core Web Vitals are a “tiebreaker” ranking signal.
We view this as the deciding factor: when two pages have similar content quality, relevance, and authority, the one with better Core Web Vitals will rank higher.
The practical impact varies by industry and competition level:
Local Search (The Map Pack): For local businesses in Honolulu competing for the top 3 spots in the Map Pack, user experience signals are critical. A slow mobile site can lead to high bounce rates, which tells Google your site isn’t a good answer for searchers.
Highly Competitive Keywords: In markets where dozens of pages compete for terms like “best surfing lessons Oahu,” Core Web Vitals can make the difference between position five and position fifteen.
E-commerce Conversion: Product pages with poor Core Web Vitals see higher bounce rates and lower conversion rates. Data consistently shows that a 1-second delay in load time can reduce conversions by up to 7%.

Tools to Measure Your Core Web Vitals
Field Data (Real User Data)
Google Search Console: The Core Web Vitals report shows aggregated data from real Chrome users visiting your site.
We consider this the “source of truth” because it reflects what your actual customers are experiencing, not just a simulation.
Chrome User Experience Report (CrUX): The raw dataset behind PageSpeed Insights. Accessible via BigQuery for detailed analysis.
Lab Data (Simulated Testing)
PageSpeed Insights: This tool combines field data with lab diagnostics. It is excellent for identifying specific technical issues, but remember that the “Performance Score” at the top is a lab simulation, not your ranking signal.
DebugBear: This is a robust monitoring tool that tracks your scores over time and provides deep insights into specific regressions.
Chrome DevTools Performance Panel: For deep-diving into specific performance issues, including long tasks and layout shifts.
The key distinction is that Google uses field data (real user measurements) for ranking decisions, not lab data. Lab data is useful for diagnosing issues, but your field scores in Search Console are what matter for SEO.
Quick Wins for Improving Performance
If your site’s Core Web Vitals need improvement, these optimizations typically deliver the most impact with the least effort:
-
Implement a CDN: We strongly recommend Cloudflare for Hawaii businesses. It caches your content on servers worldwide, ensuring a fast load time whether your customer is in Tokyo, Los Angeles, or Waikiki.
-
Compress and Resize Images: Use tools like ShortPixel or Imagify to automatically convert images to WebP and resize them. This improves both LCP and CLS.
-
Defer Non-Critical JavaScript: Add
deferorasyncattributes to scripts that are not needed for initial render. This significantly improves LCP and INP. -
Preload Critical Resources: Use
<link rel="preload">for your LCP image, critical fonts, and above-the-fold CSS. -
Remove Unused CSS and JavaScript: Audit your bundles and remove dead code. Smaller files load and parse faster.
-
Use Static Site Generation: Frameworks like Astro generate static HTML at build time, eliminating server processing delays and producing consistently fast LCP scores.
-
Optimize Third-Party Scripts: Load chat widgets, analytics, and social embeds after the page becomes interactive. Use
loading="lazy"on iframes. -
Reserve Space for Dynamic Content: Set explicit dimensions for ads, embeds, and any content that loads asynchronously.
Improving Core Web Vitals is not a one-time project.
We know that as you add content, features, and third-party integrations, performance can regress.
Set up automated monitoring to catch issues before they affect your rankings.
Want a professional assessment of your site’s performance? Contact Nekko Digital for a comprehensive SEO audit that includes Core Web Vitals analysis and prioritized recommendations.
Ready to Improve Your Search Visibility?
Get a free SEO audit and discover how Nekko Digital can help your business rank higher.
Get Free SEO Audit